
Summary of Findings
Investing in health improves health outcomes and arrests the vicious cycle of poverty and illness.
The relationship between health and the economy runs both ways, lasts throughout an individual’s lifetime, and is intergenerational.
In 2000-2011, improvements in health contributed to an estimated yearly growth in full income of 1-2% across low- and middle-income countries.
Five core mechanisms explain how health affects poverty and the economy:
- Financial protection: Removing financial barriers to access enables the use of health services when needed, and helps at-risk households avert impoverishing expenditures and poverty.
- Education: The prospect of longer, healthier lives induces people to invest more in their human capital, as they are better able to realize future long-term gains in employment and income.
- Productivity: Productivity is enhanced through the contribution of better health to increased worker capacity, lower rates of absenteeism, and less workforce turnover.
- Capital investments: Heightened longevity in lifespan and higher incomes mean people save more for retirement – boosting the economy-wide capital available for increased investments.
- The demographic dividend: With the right conditions in place, changes in population age structure with a growing and educated workforce create the opportunity for economic growth.
Case studies of three countries show how different policies were used to strengthen health systems, expand healthcare access, improve health outcomes, reduce poverty, and achieve economic growth:
- Ethiopia: Investments expanded primary health care facilities to enhance access to health services and improved financial protection by launching a community-based health insurance scheme.
- Brazil: Universal health coverage was achieved through primary care and family health teams by decentralization, expansion of human resources for health, and health system strengthening combined with welfare programs to stimulate demand for health and education.
- Turkey: The Health Transformation Program scaled up family medicine-centered primary health care, increased health expenditures, extended insurance coverage to the poor, and created a unified health insurance system with equal benefits to improve health outcomes, diminish impoverishing expenditures, and contribute to economic growth.
The success of reforms in these countries was enabled by sustained political leadership, effective use of fiscal space, a focus on universal health coverage and financial protection, an emphasis on primary health care, and the combination of supply- and demand-side interventions in the health system.
Though very successful, these countries face the rapidly growing burden of non-communicable diseases that will place demands on the government health budget. Judicious investments will be needed to develop strong health systems underpinned by comprehensive primary health care designed to manage chronic illness. Only then can the achievements in health outcomes, poverty alleviation, and economic growth be sustained.
Investing in Health for Economic Growth and Sustainable Development
Health is a catalyst and a critical ingredient for achieving economic, social, and environmental goals, including alleviating poverty and economic growth. Targeted investments can produce improvements in health outcomes, provide financial risk protection to citizens when they are ill, and produce substantial societal benefits beyond health to help achieve Sustainable Development Goals (SDGs). Conversely, ill health produces poverty and hinders economic growth, while poverty drives ill health in low-, middle-, and high-income countries alike (Deaton, 2016), creating a vicious cycle.
This report provides an overview of the evidence of the benefits of investing in health, including the mechanisms that link health, poverty alleviation, economic growth, and human development. Using case studies of Ethiopia, Turkey, and Brazil, the report presents real-world examples to illustrate how better health translates into improvements in human development. The report draws on the evidence and country cases to discuss implications for policy makers.
Evidence from Ethiopia, Turkey, and Brazil points to several important characteristics that enabled the simultaneous introduction of large-scale health and social sector reforms, including sustained political leadership, effective use of fiscal space created by economic growth, a transition towards universal health protection and coverage, an emphasis on primary health care, and a combination of supply- and demand-side interventions in the health system to expand simultaneously financial coverage and access to healthcare services.
Multidimensional Nature of Poverty
Poverty has a multidimensional character. While level of wealth or income is often used as measures of poverty, poor quality of life also characterizes poverty, including access to affordable, quality health care and education, food security, employment prospects, and the availability of water, electricity, and adequate transportation infrastructure. Inequality in health, education, and employment opportunities hinders human development.
The multidimensional poverty index (MPI) and the human development index (HDI) are designed to capture the multi-faceted nature of human development and enable comparison across countries. Health is at the core of both the MPI and HDI. The MPI provides a comprehensive picture of poverty by bringing together multiple dimensions of human development. It uses severe, overlapping deprivations in health, education, and living standards to assess individual-level poverty (Alkire, Conconi, and Seth, 2014). Individuals deprived in three or more of 10 indicators (including nutrition, child mortality, and school attendance) are considered ‘MPI poor’. The HDI also incorporates the multidimensional nature of poverty, using three core indicators: life expectancy at birth, mean years of schooling compared to expected years of schooling, and gross national income per capita.
Health and Macroeconomic Growth
Investing in health may ultimately impact macroeconomic growth and other important economic indicators (Floud et al., 2011). A rich, long-standing literature explores the relationship between health and the economy, with many economists contending that health fuels economic growth (Fogel, 1994; Gallup and Sachs, 2001; Sachs, 2001; Bloom, Canning, and Sevilla, 2004). Fundamentally, economists and other researchers agree that the relationship between health and the economy runs both ways and lasts throughout an individual’s lifetime and between generations (Deaton, 2003; Floud et al., 2011). Health status has shown to be a significant predictor of economic growth, with improvements in population health spurring increases in gross domestic product (GDP) above and beyond other drivers (WHO, 1999).
The magnitude of the effect of health on macroeconomic indicators is substantial. The Lancet Commission on Investing in Health estimated that across low- and middle-income countries, improvements in health contributed to yearly growth in full income by 1-2% per year from 2000 to 2011 (Jamison et al. 2013). In South Asia alone, the yearly value of mortality decline was equivalent to 2-9% of average growth in income per person – half as large as the value of the total increase in GDP. The effects were even larger in sub-Saharan Africa, where major improvements in health have been achieved since 2000. In high-income countries, such as the UK, improvements in nutritional status alone account for an estimated 20-30% of GDP growth between 1800 and 2000 (Fogel, 1994; Floud et al., 2011).
The Relationship Between Health, Poverty, and Economic Growth: Global Evidence
Mechanisms for Achieving Poverty Alleviation and Economic Growth Through Investing in Health
Investments in health drive economic growth and poverty alleviation in a dynamic manner and over a long time horizon. The five core mechanisms through which health affects poverty and the economy are:
- Financial protection: Ensures access to health services while preventing impoverishing expenditures.
- Education: Longer, healthier lives encourage greater investment in human capital.
- Worker productivity: Better health leads to increased workforce capacity, reduced absenteeism, and lower turnover.
- Capital investments: Higher life expectancy and incomes result in greater savings and economic investment.
- The demographic dividend: Changes in population age structure, combined with an educated workforce, drive economic growth.
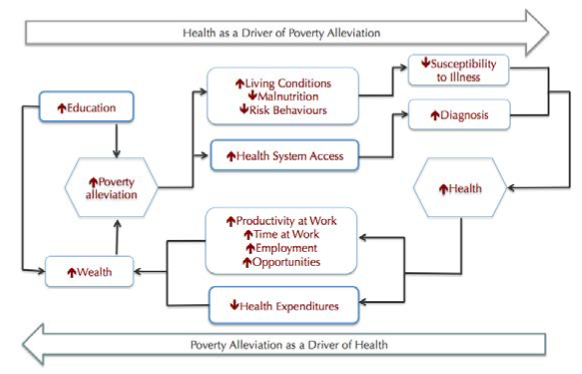
A model of the dynamics of health, poverty, and economic development
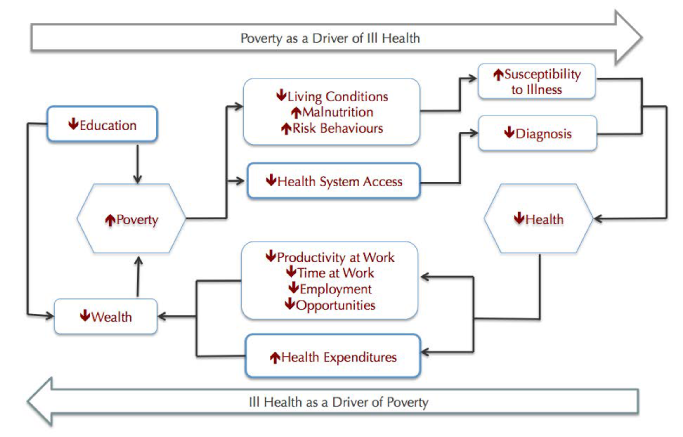
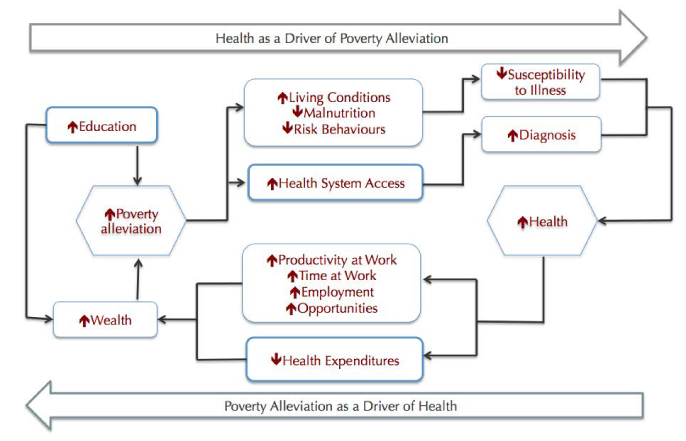
Figure 1. Source (Report Authors 2016)
- Financial protection: Financial protection when receiving care for illness impacts economic growth and poverty in two key ways. First, removing financial barriers to healthcare improves access to health services, and ultimately, enhances health outcomes. There is considerable evidence of the negative effect of user fees on access to health services, especially for the poorest segments of the population (Newhouse 1993). Removing user fees has been shown to immediately improve access to basic health services, including curative and preventive services, helping those in need to access services when they need them (Lagarde and Palmer, 2008). Second, financial protection reduces impoverishment by minimizing catastrophic health expenditures, which push households into poverty by forcing them to use savings, contract loans, or sell livestock and personal goods to cover health costs (Wagstaff 2008). Each year, an estimated 100 million people fall below the poverty line because of catastrophic health expenditures (WHO, 2010). Rates of catastrophic spending for health are usually higher in countries with limited prepayment systems or limited resources (Xu et al., 2003; Siroka et al., 2015). Investments in health systems that improve health and provide financial protection (through universal health coverage for example) reduce the incidence of impoverishing expenditures, decreasing the number of new cases of poverty.
- Education: The prospect of higher life expectancy induces people to invest more in their human capital, including education. Better health translates into better attendance at school and better cognitive functioning. The prospect of longer, healthier lives incentivizes people to commit to years of schooling up-front, as they are better able to realize future long-term gains in employment and income. (Reference)
- Productivity: Productivity is enhanced through the increased capacity engendered by improved health (Strauss and Thomas 1998; Straus 1986). High disease burden leads to higher rates of absenteeism and high turnover in the workforce, eroding productivity. Poor health in childhood – and even during pregnancy – can have long-term impacts on productivity (Buckles, Buckles, and Hungerman, 2008; Bleakley, 2010). A healthy, educated workforce is better able to use capital investments efficiently, thereby increasing total factor productivity across sectors. Workers’ contributions – whether in manual and non-manual tasks – increase, as physical and mental capacity increases with improved health. (Ref)
- Capital investments: Better health translates into higher capital investments in countries with suitable institutional and economic conditions. Heightened longevity in lifespan means people save more for retirement – savings that boost economy-wide capital available for increased investments to spur economic growth. As incomes rise with higher education and enhanced productivity, the savings rates increase (Bosworth, Bryan, and Burtless 2004). Better health means people expect to be able to reap returns in future periods, inducing them to allocate more income to capital investments. (Ref)
- The demographic dividend: As health outcomes improve, mortality falls and fertility declines, life expectancy of populations increases, providing an opportunity to reap the benefits of the demographic dividend. Demographic transition provides an opportunity to yield substantial economic benefits (Bleakley, 2010b; Bloom, Canning, and Fink, 2014). As fertility holds steady while life expectancy rises, the number of dependents initially rises. However, as this group grows older, a bulge in the working-age population emerges, leading to better dependent-working person ratios that broadly benefit the economy.
Health and Poverty Alleviation
Poverty is a critical step in the pathway that links health with economic growth. The relationship between poverty, the social determinants, and health has been extensively studied and analyzed: the impoverished often live in poor conditions, without proper access to water, sanitation, food security, or decent housing. Conversely, improved health plays a role both at individual, household, and societal levels in reducing poverty, ultimately boosting economic growth. Investing in health systems can improve health outcomes and also break the vicious circle of poverty and poor health (Wagstaff, 1987; Sachs JD, 2008).
At the microeconomic level, several studies support the conclusions of macroeconomic studies on the mechanisms through which health affects both the economy and poverty reduction (Thomas et al., 2003; Miguel and Kremer, 2004; Almond, 2006; Bleakley, 2007; Almond, Edlund, and Palme, 2009; Field, Robles, and Torero, 2009; Bleakley 2010a; Cutler et al., 2010; Lucas, 2010; Kremer et al., 2011).
Health and Sustainable Development
In 2015, the United Nations member states adopted the Sustainable Development Goals (SDGs), the successor to the Millennium Development Goals. SDG 3 aims to “ensure healthy lives and promote well-being for all at all ages” and is underscored by several health targets, including for communicable and non-communicable diseases, maternal and infant mortality, and universal health coverage. While many of the SDGs focus on climate change and environmental degradation more broadly, health is a key link between these environmental factors and human development. Health investments put countries on the path to reaching several of the SDGs, as benefits of investing in health extend beyond health system performance, by affecting poverty reduction, economic growth, and human development.
Evidence from Ethiopia, Brazil, and Turkey
Simultaneous progress in health, poverty alleviation, and economic growth make Ethiopia, Brazil, and Turkey suitable case studies for illustrating the mechanisms linking health, economic growth, reduced poverty, and sustainable development (Tables 1 and 2).
Since 2000, average yearly GDP growth has been substantial in the three countries, reaching between 2006 and 2011 to 10.9% in Ethiopia, 3.4% in Brazil, and 4.25% in Turkey. From 2000 to 2011, average life expectancy at birth rose in the three countries, from 51.9 to 62.1 years in Ethiopia, 70 to 73.6 years in Brazil, and 70 to 74.5 years in Turkey. Health spending per capita also increased between 2000 and 2011, on average rising each year by 16.2% and 10.5% in Ethiopia and Turkey respectively, and 9.9% in Brazil. (Tables 1 and 2)
Table 1. Socioeconomic Data
Demographics
| Ethiopia (2000) | Ethiopia (2014) | Brazil (2000) | Brazil (2014) | Turkey (2000) | Turkey (2014) | |
|---|---|---|---|---|---|---|
| Total population (millions) | 66.4 | 97 | 175.8 | 206.1 | 63.2 | 75.9 |
| Life expectancy at birth | 51.9 | 63.44 (2013) | 70.0 | 74.12 (2013) | 70.0 | 75.18 (2013) |
| Total fertility rate (births per woman) | 6.53 | 4.52 (2013) | 2.40 | 1.80 (2013) | 2.45 | 2.04 (2013) |
| Age dependency ratio (% of working-age population) | 98.37 | 83.57 | 53.21 | 45.1 | 58.01 | 50 |
| Urban population (% total) | 14.74 | 19 | 81.19 | 85.43 | 64.74 | 72.89 |
Epidemiology
| Prevalence of HIV (% of population ages 15 to 49) | 3.2 | 1.2 | NA | NA | NA | NA |
| Incidence of tuberculosis (per 100,000 people) | 421 | 207 | 61 | 44 | 37 | 18 |
| Estimated malaria cases | 8,900,000 | 3,800,000 (2013) | 1,200,000 | 230,000 (2013) | 12,000 | <50 (2013) |
| Diabetes (% burden of disease) | 0.40 | 0.73 (2013) | 2.43 | 3.56 (2013) | 2.39 | 4.15 (2013) |
| Hypertension (% burden of disease) | 0.23 | 0.49 | 0.55 | 0.70 | 0.70 | 0.98 |
| Probability of dying between ages 30-70 from cardiovascular disease, cancer, diabetes, or chronic respiratory disease | 15 | 19 (2012) | 25 | 19 (2012) | 18 | 24 (2012) |
Economic
| GDP at market prices (US$) | $8,242 | $55,612 | $657,216 | $2,346,076 | $266,568 | $798,429 |
| Poverty headcount ratio ($1.90/day 2011 PPP, % of population) | 36.31 (2004) | 33.54 (2010) | 13.62 (2001) | 4.87 (2014) | 2.12 (2002) | 0.26 (2012) |
| Antiretroviral therapy coverage | 0 | 50 | – | – | – | – |
| Under-five mortality rate | 145.1 | 61.8 | 32 | 16.2 | 39.6 | 17 |
| Maternal mortality ratio (per 100,000) | 897 | 378 | 66 | 46 | 79 | 14.3 |
Source: World Bank Open Data, 2016. All US$ current prices for years 2000 and 2013 unless otherwise stated. Available online: http://data.worldbank.org/
Asterisk * represents data from the World Health Organization’s Global Health Observatory data repository. Available online: http://www.who.int/gho/database/en/
Asterisk ** represents data from IHME’s Global Burden of Disease. Available online: http://vizhub.healthdata.org/gbd-compare/
Between 2000 and 2011, the share of out-of-pocket expenditures as a proportion of total health expenditures fell in Brazil by 8.1 percentage points and in Turkey by 12.6 percentage points. In Ethiopia, out-of-pocket expenditures remained relatively stable, with a small decrease of 0.5 percentage points from 2000 to 2011.
The three countries also achieved substantial improvements in reducing poverty levels. Poverty – measured as the proportion of the population living on less than $1.90 per day – declined by 26 percentage points in Ethiopia between 2000 and 2011. In Brazil and Turkey, the poverty headcount ratio fell 2.4 and 1.6 percentage points, respectively, between 2006 and 2011. (World Bank 2016; Tables 1 and 2)
Table 2. Socioeconomic Data
| Ethiopia | Brazil | Turkey | ||||
|---|---|---|---|---|---|---|
| Year | 2000 | 2013 | 2000 | 2013 | 2000 | 2013 |
| Financing | ||||||
| Health expenditure per capita (current US$) | $5.4 | $24.5 | $264.7 | $1,084.6 | $197.2 | $607.7 |
| Total Health Expenditure (% of GDP) | 4.45 | 5.06 | 7.16 | 9.67 | 4.95 | 5.59 |
| Government Health Expenditure (% total health expenditure) | 54.6 | 60.96 | 40.3 | 48.19 | 62.93 | 77.41 |
| Out-of-pocket health expenditure (% of total) | 35.95 | 35.38 | 37.95 | 29.93 | 27.65 | 14.98 |
| Coverage | ||||||
| (All social insurance) | – | – | 30.10 (2006) | 28.34 (2012) | 29.4 (2004) | 34.6 (2012) |
| External resources for health (% of total expenditure on health) | 16 | 32.3 | 0.54 | 0.06 | 0.06 | 0.04 |
| Service Delivery | ||||||
| Human resource density (physicians per 1000 population) | 0.021 | 0.022 (2010) | 1.15 | 1.89 | 1.3 | 1.711 (2011) |
| Human resource density (nurses and midwives per 100 population) | – | 0.236 (2010) | 3.84 | 7.6 | 2.93 (2006) | 2.402 (2011) |
| Skilled-birth attendance (% of total) | 5.6 | 23.1 | 96.45 (2001) | 98.1 (2011) | – | 95 (2009) |
| DPT coverage (% of children ages 12-23 months) | 30 | 77 | 98 | 93 | 85 | 98 |
Source: World Bank Open Data, 2016. All US$ current prices for years 2000 and 2013 unless otherwise stated. Available online: http://data.worldbank.org/
All the three study countries were able to improve health outcomes very substantially and demonstrated between 1995 and 2013 (the latest data available) high performance in key population health outcomes relative to GDP per capita and health spending per capita, and in relation to comparator peer countries (Figures 2A and 2B).
Figure 2A. Data sources: World Development Indicators, WHO National Health Accounts 2016
a) Infant mortality rate and b) under-5 mortality rate relative to health spending and GDP per capita

Figure 2B. Data source: World Development Indicators, WHO National Health Accounts 2016
c) Maternal mortality ratio and d) life expectancy at birth relative to health spending and GDP per capita

Ethiopia, Brazil, and Turkey achieved these improved health outcomes in different ways. The various paths pursued to improve health in these three countries, achieve economic growth, and reduce poverty provide valuable insights on how progress can be made across a variety of contexts.
Ethiopia: Ethiopia invested considerably in the health system to expand population coverage of primary health care facilities and improve financial protection through the launch of a community-based health insurance scheme.
Brazil: In Brazil, expansion of universal health coverage was facilitated by decentralization of decision-making (with community participation) and provision of health services to municipalities with financial incentives to expand primary health care, substantial investment and prioritization of primary health care through the “Family Health Strategy”, and the expansion of human resources for health.
Turkey: In Turkey, a comprehensive approach was adopted to improve the health system through the Health Transformation Program (HTP), with increased total health expenditures, the creation of a unified general health insurance system, expansion of financial protection for the poorest population through a non-contributory health insurance scheme financed by budget contributions, scale up of family medicine-centred primary health care, as well as improved access to public and private hospitals.
Ethiopia Case Study
In the 1990s, Ethiopia faced deep-rooted challenges in its health system. Low per-capita health expenditures characterized the health financing landscape. Out-of-pocket spending was above the sub-Saharan Africa average, contributing to already high rates of poverty. Population coverage of health services was low. A persistent budget deficit in the health sector hampered effective functioning of the health system (Dibaba et al., 2014).
Recognizing the shortcomings in the health system, the Government of Ethiopia launched the Health Care Financing Strategy in 1998, followed by substantial reforms to improve the functioning of the health system and population health (Ethiopian Health Insurance Agency 2015). Reforms focused on:
- Enhancing government investments in the health system: The Government of Ethiopia expanded its investments in the health sector considerably. The government more than doubled its health spending between 2000 and 2011 from $5.6 in 1999-2000 fiscal year to $7.1 in 2003-04, to $16.1 in 2007-08 and $20.8 in 2010-11 (The Ethiopian Federal Ministry of Health 2010), with government health spending growing from 2.4% to 3.7% of GDP (WHO 2016). In real terms, government health expenditure rose 38% over this period (The Ethiopian Federal Ministry of Health 2010).
- Fee waiver system: A fee waiver system was instituted to protect the “poorest of the poor” against the financial barriers to accessing health care. Eligibility of citizens for the fee waiver system is determined through community participation, with beneficiaries issued a certificate entitling them to free healthcare services (USAID, 2011). A majority of health facilities in the regions where the scheme has been implemented have revised their fee schedules (Health System Financing Reform Project 2011). Exempted services that do not charge fees include, but are not limited to: family planning, delivery, pre- and postnatal care, TB, leprosy, expanded program on immunization, voluntary HIV counselling and testing, antiretroviral therapy, and services to prevent mother-to-child transmission of HIV (USAID, 2011). Over 2.2 million waiver beneficiaries have been enrolled in the program in eight regions (USAID, 2011). While there have been some implementation challenges across regions, where the fee waiver and exemption system was fully implemented in Amhara, poor households now have better access to health services (Health System Financing Reform Project, 2011).
- Community-based insurance scheme: As part of the health financing reforms, in 2011 Ethiopia also introduced a community-based insurance (CBHI) scheme. Supported by the Federal Ministry of Health, USAID, and local and international NGOs, the scheme is designed for people working in the informal sector, representing 89% of the total population (Derseh et al., 2013).
The CBHI has been implemented in three states that have a total population of more than 60 million (National Population and Housing Census of Ethiopia, 2007). A year after implementation, 45.5% of target households had taken up the scheme and more than 40,000 households have been enrolled to date (USAID, 2011; Derseh et al., 2013). Similar to the fee waiver system, enrollment is decided collectively at the community level (as opposed to the household level). Each member pays 5 Ethiopian Bir (ETB) registration fee (around US$0.25) and an annual contribution of ETB 180 (almost US$10). The federal government provides funding for the schemes. Local and regional governments provide a subsidy for poor households unable to afford the contribution. The federal government also provides financial support to the health facilities that provide healthcare services to CBHI members.
In 2013, an assessment of the CBHI program showed that the scheme led to increased utilization and intensity of care. This, in turn, generated more financial resources for the facilities providing healthcare services for CBHI members to expand service provision. Risk of impoverishment due to OOP fell by one half for those enrolled in the CBHI scheme (Ethiopian Health Insurance Agency, 2015).
Health Outcomes, Macroeconomic Growth, and Human Development
By 2011, major changes in healthcare delivery were apparent. Ethiopia has expanded coverage of health services with an eighteen-fold increase in health posts and a seven-fold increase in the number of health centers (Ethiopian Federal Ministry of Health, 2011). Primary health care coverage increased from 51 percent in 2000 to 92 percent in 2011.
There has been substantial improvement in population health outcomes (Derseh et al., 2013). Average life expectancy at birth rose one year per year from 2000 to 2011, increasing from 52 years to 63 years (World Bank 2015). Child mortality dropped from 166 in 2000 to 88 by 2011. Maternal mortality declined from 871 to 676 per 100,000 live births. Prevalence of stunting dropped from 58% to 44% from 2000 to 2011.
Macroeconomic indicators have also been strong since 2000. Ethiopia has achieved yearly per capita growth rates of 8.3% in the last decade (World Bank, 2016), with substantial investments in infrastructure and market development, including expanded road networks and more integrated markets.
Poverty Reduction and Financial Protection
Ethiopia has made remarkable progress in reducing poverty. In 2000, 56% of the Ethiopian population was living under the $1.25 poverty line (World Bank, 2016). By 2011, this proportion had fallen to less than 30%, a rapid decline in the share of the population living in poverty.
As health has improved, school attendance has increased substantially in Ethiopia. The proportion of the population without education declined 20 percentage points from 2000 to 2011 (from 70% to 50%). The Net Attendance Rate for primary education rose from 30% to 62% over the same time period.
The contribution of health to improvements in quality of life is best captured through a decomposition of the declines in the multidimensional poverty index (MPI). Figure 3 presents how much deprivation in education, health, and living standards contributed to the MPI in Ethiopia in 2011 as compared to the cross-country average. Among those classified as poor by the MPI, health contributed 28% of deprivation, lower than the cross-country average (34%), but more than the contribution of deprivation in education (26%) in Ethiopia in 2011.
Percentage contribution of deprivations in education, health and living standards to overall poverty, 2011
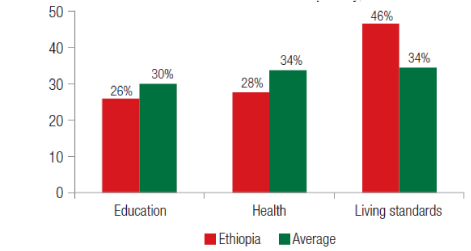
Figure 3. Source (Alkire, Conconi, and Seth, 2014)
From 2000 to 2011, the MPI for Ethiopia declined by 10%: less than the fall in the poverty headcount (33%) – a divergence driven by slower progress on living standards in the MPI than is reflected in the poverty headcount. Figure 4 compares the contribution of living standards, education, and health to the decline. Health contributed 18%, almost double the contribution of living standards, but less than the impact of education.
Percentage improvement in proportion deprived in education, health and living standards (2000-2011)
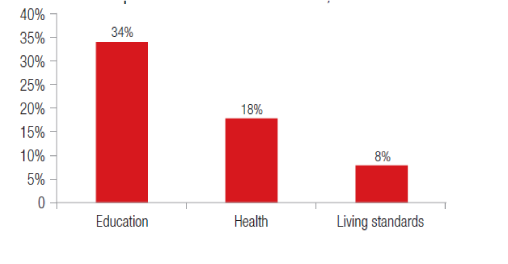
Figure 4. Source (Alkire, Conconi, and Seth, 2014)
Employment, Retirement, and Workforce Productivity
The Government of Ethiopia instituted improvements in its health system as part of a concerted state effort to pursue a “developmental state” model, which placed poverty reduction at its core. In doing so, Ethiopia has effectively used Overseas Development Assistance (ODA) to rapidly achieve government goals.
Since 2000, public investment in health and education has been a central feature of Ethiopia’s development strategy, augmented by ODA (World Bank, 2015). These efforts have led to major improvements in health, education, economic growth, and human development.
Notwithstanding successes, Ethiopia faces three interlinked future challenges. The first relates to an effective transition to a health system funded predominantly from domestic sources by reducing dependence on ODA. Strong economic growth and prudent fiscal management should help this transition. The second is the rapid demographic and epidemiological transition that will bring NCDs that will have to be effectively managed while addressing the infectious disease burden. The third relates to continued investments to achieve UHC, which must be underpinned by strong primary care to ensure access to comprehensive health services designed to address simultaneously infectious diseases, maternal and child health, and the rising burden of NCDs to sustain the gains in health, economic growth, and human development.
Brazil Case Study
Creation of the Brazilian Unified Health System (Sistema Único de Saúde) was part of a social movement, which underpinned the population’s fight against the military dictatorship to secure democratization and citizens’ rights. The 1988 Constitution, shaped by a democratic struggle and the Movement for Sanitary Reform (Movimento de Reforma Sanitaria), established health ‘as a fundamental right and a responsibility of the State’, with provisions to create a unified national health system (Atun et al., 2015).
The Unified Health System was established to achieve universal health coverage – part of a series of post-dictatorship social sector reforms in Brazil – aimed at improving health outcomes, providing financial risk protection, alleviating poverty, and reducing socioeconomic inequalities (Atun et al., 2014). Social sector reforms combined demand-side interventions, such as conditional cash transfers, and multisectoral action aimed at alleviating poverty by targeting social determinants of health. Reforms also combined supply-side changes to strengthen the health system in order to improve access for citizens, especially the most disadvantaged populations (Atun, 2015; Monteiro de Andrade et al., 2015).
The Unified Health System aimed to address high levels of infant and child mortality (especially from vaccine-preventable diseases), infectious diseases such as dengue, HIV, and tuberculosis, the rising prevalence of cardiovascular disease, and high levels of violence. Primary health care was strengthened as the platform for introducing multisectoral interventions and enhancing access to immunization and prenatal care, primary health care services, emergency care, and essential pharmaceuticals (many of which were manufactured in Brazil) (Paim et al., 2011; Atun, 2015; Monteiro de Andrade, 2015).
Alongside the prioritization of primary health care, the major characteristics of Brazil’s health system reform were:
- Social participation and advocacy
- Decentralization across a geographically, environmentally, and socio-economically diverse country
- Expansion of human resources for health
These changes led to substantial improvements in average life expectancy at birth, which rose from 67.7 and 63.0 years for women and men in 1990, to 78.4 years for women and 71.6 years for men respectively in 2013. Infant mortality fell from 58 per 1,000 live births in 1990 to 15 per 1,000 live births in 2015.
However, in spite of these achievements, inequities in income distribution, levels of poverty, violence, and regional variation in health outcomes persist (Atun et al., 2015). Compared with 1990, premature mortality due to diabetes, as measured by years of life lost (YLLs) in 2013, increased by 43%. Furthermore, years of life lived with disability (YLDs) as a result of diabetes increased by 123% in the same time period (IHME 2013). In addition, alcohol misuse, tobacco smoking, undernutrition, and obesity have subsequently risen (Paim et al., 2011; Atun et al., 2015). These trends are concerning and, without concerted action, have major implications for the economic growth of the country.
Socioeconomic Welfare and Human Development
Between 1991 and 2008, Brazil’s gross domestic product (GDP) almost doubled from $608 billion to $1 trillion (constant US$), and per capita gross national income rose from $3,887 to $5,048 (World Bank 2016). The economic growth enabled the Government of Brazil to introduce ambitious welfare reforms, with policies aimed at stimulating and accelerating prosperity.
In 2008, five years after its establishment, the “Bolsa Família” conditional cash transfer program distributed over US$7 billion to 10.5 million families. In 2014, this amount increased to US$11.2 billion, accounting for 0.5% of GDP and covering one in four Brazilians (Paes-Sousa, 2013). Bolsa Família was an important contributing factor to the reduction in poverty by 27.7% during the administration of President Lula da Silva (Brandao Junior and Aragao, 2007).
Brazil has systematically increased the legal minimum wage since 2000. In 2010, the Brazilian Social Security System distributed pensions, retirement benefits, health benefits, and welfare assistance to 28 million Brazilians each month, amounting in total to US$153 billion, equivalent to 6.9% of GDP that year. The Social Security System offers financial protection to workers and their families in times of crisis precipitated by illness, accident, and imprisonment, and during periods of pregnancy and old age.
In addition to the Unified System for Social Assistance (Sistema Único de Assistencia Social), the Federal government’s anti-poverty program “Brasil sem Miséria” (Brazil Without Extreme Poverty) provides integrated support for the country’s poorest families – in particular those residing in the north and northeast regions of Brazil. Launched in 2011, Brasil sem Miséria expands Bolsa Família with the aim of eradicating extreme poverty by targeting 15 million of the country’s most neglected persons (Paes-Sousa, 2013). The program provides support for welfare, nutrition, health, education, housing, alongside employment and income support in order to raise per capita household income, enhance access to public goods and services, and improve access to employment and economic opportunities.
Policies go beyond cash transfers, seeking to develop capacity and skills for Brazilians to contribute more fully and more productively to the labor market. Together, these and other social and health initiatives (see Appendix Table 1 and Table 2) simultaneously invest in health and development, in an effort to create socioeconomic conditions conducive for economic growth.
Health, Poverty Alleviation, and Financial Protection: Achievements and Challenges
Social protection programs and financial protection have contributed to consistent improvements in alleviating poverty and reducing inequalities in Brazil (Paes-Sousa, 2013). Compared with other countries in Latin America (Appendix Table 3), Brazil has achieved lower levels of catastrophic health expenditures (Knaul et al., 2011), although out-of-pocket expenditures approaching 30% of total health expenditures in 2013 are relatively high (World Bank, 2013).
However, despite poverty alleviation and improvements in coverage of health services that are free at the point of delivery in the Unified Health System, some citizens incur catastrophic health expenditures (Montoya Díaz et al., 2012) when purchasing medicines. The assistance towards the cost of drugs is limited to specific diseases and treatments. In addition, two federal programs (Program for Sexually Transmitted Infections Treatment and Prevention, and the Program for the Dispensation of Special Medications for chronic conditions) provide assistance for costly medications. In 2012, one in four Brazilians had purchased an additional voluntary health plan or health insurance, but few of these covered costs of prescription drugs (Montoya Díaz et al., 2012).
Inequities persist in coverage of primary health care, with low coverage in the Northeast region and the Amazonian North, which have high levels of poverty, low-income levels, low educational attainment, high burden of communicable and non-communicable diseases, and segregation by race and ethnicity.
Employment, Retirement, and Workforce Productivity
Described as an “economic time bomb” (The Economist 2012), Brazil has 35 pensioners for every 100 contributing workers, and 13% of GDP is spent on pensions – more than any G7 country with the exception of Italy. This presents substantial challenges to Brazil as it faces an aging population with an increasing number of chronic conditions (Romero 2015).
Improvements in longevity bring challenges. In the 1950s, 90% of Brazilians aged 60-64 years were contributing to the workforce. In 2000, just 65% of the same age group remained in active employment. This shift was most evident in the public sector, which in 2002 had an average age of retirement and exit from employment of 52 years, compared to the official retirement age of 65 years for men and 60 years for women (Queiroz 2007). The average age of retirement across all sectors in Brazil is around 55 years (Queiroz, 2007).
Challenges in Productivity and Economic Growth
Productivity and investment are the cornerstones of economic growth. However, pension obligations and rapidly rising non-communicable diseases that bring chronic illness place a heavy burden on the government budget, reduce productivity, and limit economic growth in Brazil – which has experienced difficulty sustaining productivity growth, including total factor productivity, with declining investments as a proportion of GDP compared to other countries of South America (Palma, 2010).
Brazil needs greater public investment in cross-sectoral policies to improve health, education, and sustainable development – alongside pension reform – to boost productivity and address emerging adverse trends.
Turkey Case Study
During the 1990s, Turkey experienced political instability, an underperforming economy with rampant inflation, wide income inequalities, and few improvements in its health system (Atun et al., 2013). As a result, by the end of the 1990s, the Turkish health system faced major gaps in financial coverage and access to healthcare services. Only 66.3% of the population was covered by health insurance in 2003.
Inequitable and inadequate financing impeded access to health services for the poorest segments of the population who suffered impoverishing health expenditures, worsened by maldistribution and absolute shortage of human resources and infrastructures. As a result, although average life expectancy at birth increased through the 1990s, geographic and social inequities in health outcomes persisted (Atun et al., 2013).
To address the shortcomings in the health system and poor health outcomes, Turkey introduced the Health Transformation Program (HTP) in 2003. The HTP combined supply- and demand-side interventions to expand coverage of health financing and service delivery, enabled by economic growth that created the fiscal space to increase total health expenditures. Rapid scale-up of family medicine-centred primary health care was accompanied by expansion of health insurance coverage and the creation of a unified general health insurance system that brought together four separate health insurance schemes for blue-collar workers, civil servants, retired civil servants, and the self-employed, with aligned benefits for all population groups.
Contracts were used to source human resources for underprivileged areas of the country and to increase hospital capacity by engaging the private sector (Atun, 2015).
Health system reforms were effective in improving key health outcomes and providing financial protection, especially for the most disadvantaged population groups (Atun, 2015). Improved financial protection diminished catastrophic expenditures and contributed to poverty reduction at the national level. Although the evidence remains mixed, recent studies suggest a positive relation between increased health expenditures and economic growth in Turkey (Arisoy, Ünlükaplan, and Ergen, 2010; Kurt, 2015).
Health Outcomes, Socioeconomic Welfare, and Human Development
Maternal, child, and neonatal mortality are sensitive indicators of health system performance and are closely related to the availability of health resources (Dickson et al., 2014). In Turkey, between 1998 and 2009, neonatal mortality declined from 26 per 1,000 live births to 10 – a decline achieved by OECD countries in 30 years (Demirel et al., 2013). Infant and maternal mortality also declined (Baris et al., 2011; Atun et al., 2013).
Between 2000 and 2010, Turkey was ranked first among 113 low-income and middle-income countries in the rate of decline of under-five mortality (Verguet and Jamison, 2014). Between 2000 and 2008, average life expectancy at birth rose from 70 to 73 years (Baris, Mollahaliloglu, and Aydin, 2011). The HTP significantly reduced health inequities between different social groups (Atun et al., 2013).
Poverty Alleviation and Financial Protection
Expansion of the green card scheme led to an increase in insurance coverage for the poorest groups from 2.4 million in 2003 to 10.2 million people in 2011 (Ökem and Çakar, 2015). This enhanced financial protection led to a decrease in the share of out-of-pocket payments out of total health expenditures, especially for lowest-income households, and a decline in catastrophic health expenditures between 2003 and 2011 (Atun et al., 2013; Yardim et al., 2014).
Some studies argue that high-income groups benefited more from the decrease of out-of-pocket health expenditures (Erus and Aktakke, 2012), and between 2004 and 2010, the percentage of households who incurred catastrophic health expenditures may have increased (Özgen Narcı et al., 2015). While the HTP had a clear impact on financial and geographic equity, further studies are needed to eliminate regressive out-of-pocket patterns (Ökem and Çakar, 2015).
Health and Macroeconomic Growth
Studies examining the relationship between health expenditures and macroeconomic growth in Turkey since the 1960s show mixed results (Kurt, 2015). One study finds a positive impact of economic growth on total health expenditures, with a 10% increase in per capita GDP associated with an 8.7% increase in per capita health expenditures between 1984 and 2006 (Sulku and Bernard, 2012).
Two other studies suggest a positive impact of social and health investments on long-term macroeconomic growth: one study shows the positive effect of health and education expenditures on the Turkish economy for the period 1960-2005 (Arisoy, Ünlükaplan, and Ergen, 2010), and the other, which analyzes the impact of general government medicine and health expenditures on the Turkish economy between 2006 and 2013, finds a positive effect of government health expenditures on total expenditures, aggregate demand, and total production, and a negative impact of the expenditures in other sectors (Kurt, 2015).
Employment, Retirement, and Workforce Productivity
As with Brazil, the demographic and epidemiological shifts mean that Turkey faces a rapidly rising burden of non-communicable disease, an ageing population, and growing pension obligations. The rising chronic illness will place demands on the government health budget, and if not effectively managed, will have adverse consequences on population health outcomes, financial well-being, and economic growth.
To build on its success, Turkey needs to maintain the momentum in health systems reform and develop multisectoral policies to further strengthen primary health care and to establish a comprehensive set of services designed to prevent NCDs and effectively manage chronic illness (Atun et al., 2013).
Policy Implications
The three case studies from Ethiopia, Brazil, and Turkey examine the impact of investing in health systems on several health outcomes, economic growth, and sustainable development.
While the evaluation of the impact of the reforms is ongoing, direct and indirect effects of health investment in these countries are already apparent, with regards to improved health outcomes, financial protection, and poverty reduction.
Although implemented at different stages, and in different contexts, investments in health in these countries share several common characteristics:
- Sustained political leadership: Political stability and sustained political leadership helped to introduce decisive and comprehensive reforms that combined social sector and health system reforms, with support across the government, which was crucial to achieve improvements in health, financial protection, improved economic growth, and development.
- Effective use of fiscal space: The three countries used the fiscal space created by economic growth effectively to invest in the health system, especially in primary health care to improve coverage, efficiency, effectiveness, equity, and responsiveness of health services.
- A transition towards universal health protection and coverage: Expanding access to health services and reducing catastrophic expenditures, especially for poor households, was an explicit goal of all three countries for improving financial protection.
- An emphasis on developing strong primary health care: Although each country adopted a specific set of interventions, all placed a great emphasis on improving access to primary health care, either through the strengthening of family medicine, such as in Turkey, or through the expansion of decentralized primary health care in Ethiopia and Brazil with the use of health extension workers and community health workers.
- A combination of supply- and demand-side interventions in the health system: As governments designed and implemented the reforms, policymakers recognized the need to simultaneously address both supply- and demand-side barriers to healthcare by introducing policies and interventions to stimulate demand and expand supply to enhance access to health services.
Though very successful, these countries face the rapidly growing burden of non-communicable diseases that will place demands on the government health budget. Judicious investments will be needed to develop strong health systems underpinned by comprehensive primary health care designed to manage chronic illness. Only then can the impressive achievements in health outcomes, poverty alleviation, and economic growth be sustained.
References
- Acemoglu, Daron, and Simon Johnson. 2007. “Disease and Development: The Effect of Life Expectancy on Economic Growth.” Journal of Political Economy 115 (6): 925–85. doi:10.1086/529000.
- Alkire, Sabina, Adriana Conconi, and Suman Seth. 2014. “Multidimensional Poverty Index 2014: Brief Methodological Note and Results.” Oxford: University of Oxford. Link.
- Almond, Douglas. 2006. “Is the 1918 Influenza Pandemic Over? Long‐ Term Effects of In Utero Influenza Exposure in the Post‐ 1940 U.S. Population.” Journal of Political Economy 114 (4): 672–712. doi:10.1086/507154.
- Almond, Douglas, Lena Edlund, and Mårten Palme. 2009. “Chernobyl’s Subclinical Legacy: Prenatal Exposure to Radioactive Fallout and School Outcomes in Sweden.” The Quarterly Journal of Economics 124 (4): 1729–72. doi:10.1162/qjec.2009.124.4.1729.
- Arisoy, Ibrahim, Ilter Ünlükaplan, and Zuhal Ergen. 2010. “The Relationship between Social Expenditures and Economic Growth: A Dynamic Analysis Intended for 1960-2005 Period of the Turkish Economy.” Maliye Dergisi 158: 398–421.
- Ashraf, Quamrul H., Ashley Lester, and David N. Weil. 2008. “When Does Improving Health Raise GDP?” Working Paper 14449. National Bureau of Economic Research. Link.
- Atun, Rifat. 2015. “Transforming Turkey’s Health System — Lessons for Universal Coverage.” New England Journal of Medicine 373 (14): 1285–89. doi:10.1056/NEJMp1410433.
- Atun, Rifat, Sabahattin Aydın, Sarbani Chakraborty, Safir Sümer, Meltem Aran, Ipek Gürol, Serpil Nazlıoğlu, et al. 2013. “Universal Health Coverage in Turkey: Enhancement of Equity.” The Lancet 382 (9886): 65–99. doi:10.1016/S0140-6736(13)61051-X.
- Atun, Rifat, Luiz Odorico Monteiro de Andrade, Gisele Almeida, Daniel Cotlear, T. Dmytraczenko, Patricia Frenz, Patrícia Garcia, et al. 2015. “Health-System Reform and Universal Health Coverage in Latin America.” The Lancet 385 (9974): 1230–47. doi:10.1016/S0140-6736(14)61646-9.
- Baris, Enis, Salih Mollahaliloglu, and Sabahattin Aydin. 2011. “Healthcare in Turkey: From Laggard to Leader.” BMJ 342 (January): c7456. doi:10.1136/bmj.c7456.
- Bleakley, Hoyt. 2007. “Disease and Development: Evidence from Hookworm Eradication in the American South.” The Quarterly Journal of Economics 122 (1): 73–117. doi:10.1162/qjec.121.1.73.
- Bloom, David E., and David Canning. 2000. “Population Health and Economic Growth.” Washington D.C.: World Bank Group. Link.
- Bloom, David E., David Canning, and Günther Fink. 2014. “Disease and Development Revisited.” Journal of Political Economy 122 (6): 1355–66. doi:10.1086/677189.
- Brandao Junior, Nilson, and Marianna Aragao. 2007. “Miséria No Brasil Cai 27,7% No 1o Mandato de Lula.” Estadão, September 20. Link.
- Buckles, Kasey, Kasey Buckles, and Daniel M. Hungerman. 2008. “Season of Birth and Later Outcomes: Old Questions, New Answers.” NATIONAL BUREAU OF ECONOMIC RESEARCH (CAMBRIDGE, MA) WORKING PAPER. http://citeseerx.ist.psu.edu/viewdoc/summary?doi=10.1.1.584.9681.
- Commission on Social Determinants of Health. 2008. “Closing the Gap in a Generation: Health Equity through Action on the Social Determinants of Health.” Geneva: World Health Organization. Link.
- Cutler, David, Winnie Fung, Michael Kremer, Monica Singhal, and Tom Vogl. 2010. “Early-Life Malaria Exposure and Adult Outcomes: Evidence from Malaria Eradication in India.” American Economic Journal: Applied Economics 2 (2): 72–94. doi:10.1257/app.2.2.72.
- Deaton, Angus. 2003. “Health, Inequality, and Economic Development.” Journal of Economic Literature 41 (1): 113–58.
- Deaton, Angus. 2006. “On Death and Money: History, Facts, and Explanations.” JAMA. Published online April 10, 2016. doi:10.1001/jama.2016.4072.
- Demirel, Gamze, Basak Tezel, Sema Ozbas, Serife Suna Oguz, Omer Erdeve, Nurdan Uras, and Ugur Dilmen. 2013. “Rapid Decrease of Neonatal Mortality in Turkey.” Maternal and Child Health Journal 17 (7): 1215–21. doi:10.1007/s10995-012-1115-7.
- Derseh, Anagaw, Robert Sparrow, Zelalem Debebe, Getnet Alemu, and Arjun Singh Bedi. 2013. “Enrolment in Ethiopia’s Community Based Health Insurance Scheme.” ISS Working Paper Series / General Series 578 (December): 1–35.
- Dibaba, A, M Hadis, S Ababor, and Y Assefa. 2014. “Improving Health Care Financing in Ethiopia.” Addis Ababa: Ethiopian Public Health Institute. Link.
- Dickson, Kim E, Aline Simen-Kapeu, Mary V Kinney, Luis Huicho, Linda Vesel, Eve Lackritz, Joseph de Graft Johnson, et al. 2014. “Every Newborn: Health-Systems Bottlenecks and Strategies to Accelerate Scale-up in Countries.” The Lancet 384 (9941): 438–54. doi:10.1016/S0140-6736(14)60582-1.
- Erus, Burcay, and Nazli Aktakke. 2012. “Impact of Healthcare Reforms on out-of-Pocket Health Expenditures in Turkey for Public Insurees.” The European Journal of Health Economics: HEPAC: Health Economics in Prevention and Care 13 (3): 337–46. doi:10.1007/s10198-011-0306-2.
- Ethiopian Health Insurance Agency. 2015. “Evaluation of Community-Based Health Insurance Pilot Schemes in Ethiopia: Final Report.” Addis Ababa: Ethiopian Health Insurance Agency. Link.
- Ethiopia Federal Ministry of Health. April 2014. Ethiopia’s Fifth National Health Accounts 2010/2011. Addis Ababa, Ethiopia.
- Field, Erica, Omar Robles, and Maximo Torero. 2009. “Iodine Deficiency and Schooling Attainment in Tanzania.” American Economic Journal: Applied Economics 1 (4): 140–69.
- Floud, Roderick, Robert W Fogel, Bernard Harris, and Sok Chul Hong. 2011. The Changing Body: Health, Nutrition, and Human Development in the Western World since 1700. New York: Cambridge University Press. Link.
- Fogel, Robert W. 1994. “Economic Growth, Population Theory, and Physiology: The Bearing of Long-Term Processes on the Making of Economic Policy” 84 (3): 369–95.
- Galarraga O, Sosa-Rubi SG, Salinas-Rodriguez A, Sesma-Varquez S. 2010. “Health insurances for the poor: impact on catastrophic and out-of-pocket health expenditures in Mexico.” The European Journal of Health Economics 11 (5): 437-447.
- Gallup, J. L., and J. D. Sachs. 2001. “The Economic Burden of Malaria.” The American Journal of Tropical Medicine and Hygiene 64 (1-2 Suppl): 85–96.
- Health System Financing Reform Project. 2011. “Assessment of User Fee Revisions in Public Health Facilities in Ethiopia: SNNP Regional Report.” Hawassa: USAID.
- HEPCAPS11 Project Team 2. 2012. “Developing Primary Health Care Delivery in Lower and Middle Income Countries: Challenges Faced and Lessons Learned.” Boston, MA, and New Haven, CT: Harvard School of Public Health and Global Health Leadership Institute at Yale University.
- IHME. 2013. “Country Profiles.” Seattle: Institute for Health Metrics and Evaluation.
- Jamison, Dean T., Lawrence H. Summers, George Alleyne, Kenneth J. Arrow, Seth Berkley, Agnes Binagwaho, Flavia Bustreo, et al. 2013. “Global Health 2035: A World Converging within a Generation.” Lancet (London, England) 382 (9908): 1898–1955. doi:10.1016/S0140-6736(13)62105-4.
- Knaul, Felicia Marie, Rebeca Wong, Héctor Arreola-Ornelas, Oscar Méndez, and Network on Health Financing and Social Protection in Latin America and the Caribbean (LANET). 2011. “Household Catastrophic Health Expenditures: A Comparative Analysis of Twelve Latin American and Caribbean Countries.” Salud Pública De México 53 Suppl 2: s85–95.
- Kremer, Michael, Jessica Leino, Edward Miguel, and Alix Peterson Zwane. 2011. “Spring Cleaning: Rural Water Impacts, Valuation, and Property Rights Institutions*.” The Quarterly Journal of Economics 126 (1): 145–205. doi:10.1093/qje/qjq010.
- Kurt, Serdar. 2015. “Government Health Expenditures and Economic Growth: A Feder–Ram Approach for the Case of Turkey.” International Journal of Economics and Financial Issues 5 (2): 441–47.
- Lagarde M, Palmer N. “The impact of user fees on health service utilization in low- and middle-income countries: how strong is the evidence?” Bulletin of the World Health Organization 86: 839-848.
- Lucas, Adrienne M. 2010. “Malaria Eradication and Educational Attainment: Evidence from Paraguay and Sri Lanka.” American Economic Journal: Applied Economics 2 (2): 46–71. doi:10.1257/app.2.2.46.
- Miguel, Edward, and Michael Kremer. 2004. “Worms: Identifying Impacts on Education and Health in the Presence of Treatment Externalities.” Econometrica 72 (1): 159–217. doi:10.1111/j.1468-0262.2004.00481.x.
- Monteiro de Andrade LO, Filho AP, Solar O, Rigoli F, Malagon de Salazar L, Castell-Florit Serrate P, Ribeiro KG, Swift Koller T, Bravo Cruz FN, Atun R. 2015. “Social determinants of health, universal health coverage, and sustainable development: case studies from Latin American countries.” The Lancet 385 (9975): 1343-1351.
- Montoya Díaz, María Dolores, Flavia Mori Sarti, Antonio Carlos Coelho Campino, and Roberto Iunes. 2012. “Catastrophic Health Expenditure in Brazil: Regional Differences, Budget Constraints and Private Health Insurance.” In Financing Health in Latin America, Volume 1: Household Spending and Impoverishment, edited by Felicia Marie Knaul, Rebeca Wong, and Héctor Arreola-Ornelas, 111–26. Cambridge, MA: Harvard University Press. Link.
- National Population and Housing Census of Ethiopia. 2007. Addis Ababa, Ethiopia. Link.
- Newhouse JP. 1993. “Free for All? Lessons from the RAND Health Insurance Experiment”. Cambridge: Harvard University Press. Link.
- Ökem, Zeynep Güldem, and Mehmet Çakar. 2015. “What Have Health Care Reforms Achieved in Turkey? An Appraisal of the ‘Health Transformation Programme.’” Health Policy 119 (9): 1153–63. doi:10.1016/j.healthpol.2015.06.003.
- Özgen Narcı, Hacer, İsmet Şahin, and Hasan Hüseyin Yıldırım. 2015. “Financial Catastrophe and Poverty Impacts of out-of-Pocket Health Payments in Turkey.” The European Journal of Health Economics: HEPAC: Health Economics in Prevention and Care 16 (3): 255–70. doi:10.1007/s10198-014-0570-z.
- Paes-Sousa, Romulo. 2013. “New Strategy for Poverty Eradication in Brazil: The Emergence of the Brasil Sem Miséria Plan.” 214. Brasilia: International Policy Centre for Inclusive Growth. Link.
- Paim, Jairnilson, Claudia Travassos, Celia Almeida, Ligia Bahia, and James Macinko. 2011. “The Brazilian Health System: History, Advances, and Challenges.” Lancet (London, England) 377 (9779): 1778–97. doi:10.1016/S0140-6736(11)60054-8.
- Palma, José Gabriel. 2010. “Why Has Productivity Growth Stagnated in Most Latin American Countries since the Neo-Liberal Reforms?” Cambridge: University of Cambridge. Link.
- Queiroz, Bernardo Lanza. 2007. “The Determinants of Male Retirement in Urban Brazil.” Nova Economia 17 (1): 11–36. doi:10.1590/S0103-63512007000100001.
- Romero, Simon. 2015. “An Exploding Pension Crisis Feeds Brazil’s Political Turmoil.” The New York Times, October 20. Link.
- Sachs, JD. 2001. “Macroeconomics and Health: Investing in Health for Economic Development.” Report of the Commission on Macroeconomics and Health. Geneva: World Health Organization. Link.
- Siroka A, Ponce NA, Lönnroth K. 2015. “Association between spending on social protection and tuberculosis burden: a global analysis.” The Lancet Infectious Diseases 16 (4): 473-479.
- Somkotra T, Lagrada LP. 2009. “Which households are at risk of catastrophic health spending: experience in Thailand after universal coverage.” Health Affairs 28 (3): 467-478.
- Strauss, John, and Duncan Thomas. 1998. “Health, Nutrition, and Economic Development.” Journal of Economic Literature 36 (2): 766–817.
- Sulku, S Nur, and D Minbay Bernard. 2012. “Financial Burden of Health Care Expenditures: Turkey.” Iranian Journal of Public Health 41 (3): 48–64.
- The Economist. 2012. “Tick, Tock.” The Economist, March 24. Link.
- The Ethiopian Federal Ministry of Health. 2010. “Ethiopia’s Fourth National Health Accounts, 2007/2008.” Addis Ababa: The Ethiopian Federal Ministry of Health.
- ———. 2011. “Health and Health Related Indicators for 2003 EC (2011 GC).” Addis Ababa: The Ethiopian Federal Ministry of Health.
- Thomas, Duncan, Elizabeth Frankenberg, Jed Friedman, Jean-Pierre Habicht, Mohammed Hakimi, Nathan Jones, Christopher McKelvey, et al. 2003. “Iron Deficiency and the Well-Being of Older Adults: Early Results from a Randomized Nutrition Intervention.” In . San Francisco. Link.
- USAID. 2011. “Ethiopia Health Sector Financing Reform Midterm Project Evaluation.” Washington D.C.: USAID. Link.
- Verguet, Stéphane, and Dean T. Jamison. 2014. “Estimates of Performance in the Rate of Decline of under-Five Mortality for 113 Low- and Middle-Income Countries, 1970-2010.” Health Policy and Planning 29 (2): 151–63. doi:10.1093/heapol/czs143.
- Wagstaff, Adam. 1987. “Government Prevention Policy and the Relevance of Social Cost Estimates.” British Journal of Addiction 82 (5): 461–67. doi:10.1111/j.1360-0443.1987.tb01502.x.
- ———. 2008. “Measuring Financial Protection in Health.” SSRN Scholarly Paper ID 1106043. Rochester, NY: Social Science Research Network. Link.
- Wagstaff, Adam, and Eddy van Doorslaer. 2003. “Catastrophe and Impoverishment in Paying for Health Care: With Applications to Vietnam 1993-1998.” Health Economics 12 (11): 921–34. doi:10.1002/hec.776.
- Whitehead, M, and G Dahlgren. 1991. “What Can Be Done about Inequalities in Health?” The Lancet 338 (8774): 1059–63. doi:10.1016/0140-6736(91)91911-D.
- WHO. 1999. “The World Health Report 1999: Making a Difference.” Geneva: World Health Organization. Link.
- ———. 2000. “The World Health Report 2000 – Health Systems: Improving Performance.” Geneva: World Health Organization. Link.
- ———. 2010. “The World Health Report: Health Systems Financing, the Path to Universal Coverage.” Geneva: World Health Organization. Link.
- ———. 2016. “Global Health Expenditures Database.” Geneva: World Health Organization. Link.
- World Bank. 2015. “Ethiopia Poverty Assessment 2014.” Washington D.C.: World Bank Group. Link.
- ———. 2016. “World Development Indicators.” February 16. Link.
- Yardim MS, Cilingiroglu N, Yardim N. 2010. “Catastrophic health expenditure and impoverishment in Turkey.” Health Policy 94 (1): 26-33.
- Xu, Ke, David B. Evans, Kei Kawabata, Riadh Zeramdini, Jan Klavus, and Christopher J. L. Murray. 2003. “Household Catastrophic Health Expenditure: A Multicountry Analysis.” Lancet (London, England) 362 (9378): 111–17. doi:10.1016/S0140-6736(03)13861-5.
Appendix
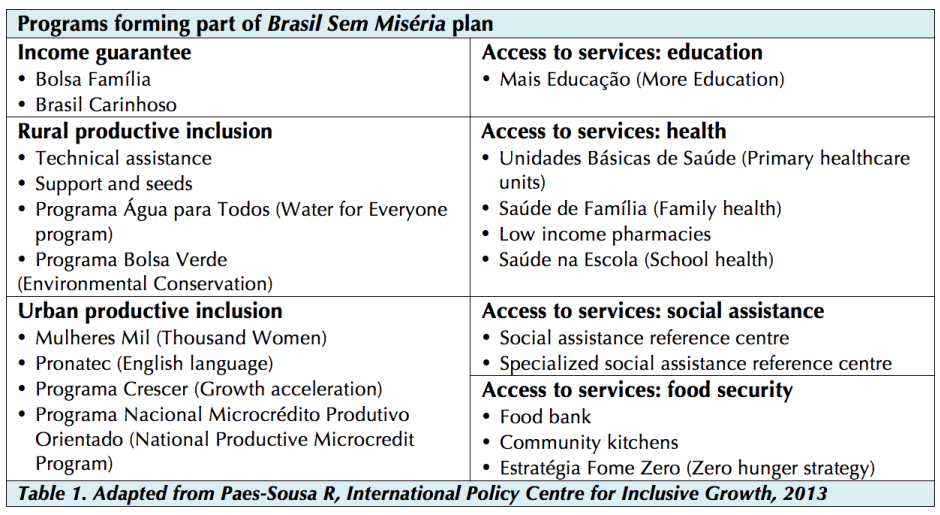
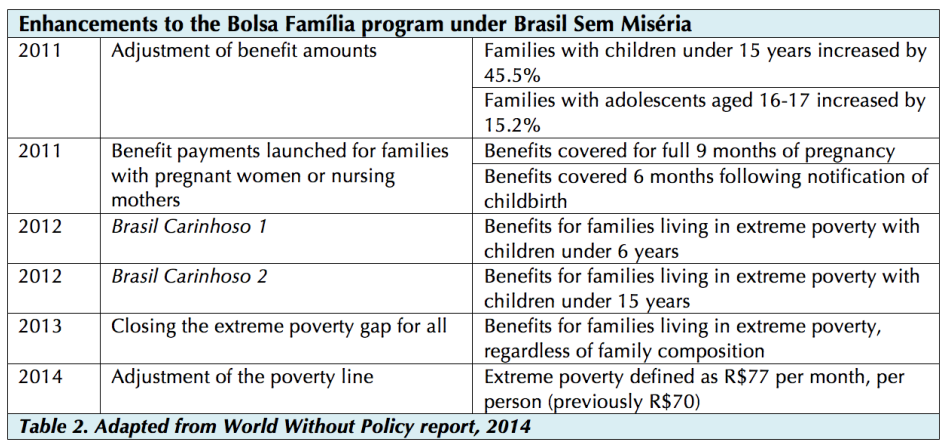
Table 3. Socioeconomic Data (Source: World Bank Open Data, 2014)
| Argentina | Brazil | Chile | Colombia | Mexico | Peru | Venezuela* | |
|---|---|---|---|---|---|---|---|
| GDP (US$, billions) | 537.7 | 2,346.1 | 258.1 | 377.7 | 1,294.7 | 202.6 | 381.3 |
| GDP (US$, per capita) | 12,509.5 | 11,384.4 | 14,528.3 | 7,903.9 | 10,325.6 | 6,541.0 | 12,771.6 |
| Health Spending (US$, per capita) | 1,074 | 1,085 | 1,204 | 533 | 664 | 354 | 520 |
| Total Health Expenditure (%GDP) * | 7.3 | 9.7 | 7.7 | 6.8 | 6.2 | 5.3 | 3.6 |
| Out-of-Pocket Health Expenditure (%THE) * | 21.1 | 29.9 | 31.7 | 13.9 | 44.1 | 34.9 | 65.8 |
| Literacy (Female %) | 98 | 92 | 97 | 94 | 93 | 91 | 95 |
| Literacy (Male %) | 98 | 91 | 97 | 93 | 95 | 97 | 95 |
| Life Expectancy at Birth (Female) | 79.6 | 78.4 | 81.7 | 78.9 | 78.7 | 78.7 | 79.3 |
| Life Expectancy at Birth (Male) | 72.3 | 71.6 | 76.3 | 72.3 | 72.2 | 75.5 | 71.8 |
| Life Expectancy at 50 Years (Female) | 32.3 | 31.6 | 33.5 | 32.0 | 31.7 | 32.0 | 32.2 |
| Life Expectancy at 50 Years (Male) | 26.4 | 27.5 | 29.5 | 28.4 | 27.7 | 30.0 | 28.1 |
| Health-Adjusted Life Years at Birth (Female) | 69.4 | 67.0 | 70.8 | 67.6 | 67.8 | 67.2 | 68.2 |
| Health-Adjusted Life Years at Birth (Male) | 64.2 | 62.8 | 67.3 | 63.2 | 63.8 | 65.0 | 63.3 |
Source: World Bank Open Data, 2014. All US$ current prices, unless otherwise stated. Available online: http://data.worldbank.org/
Life expectancy data source: Institute for Health Metrics and Evaluation, 2013. Asterisk * represents data from 2012-2013.